Disclaimer
- Tracking food consumption this meticulously may cause a person to develop an unhealthy relationship with food. That is not the goal. If you are experiencing an eating disorder, please talk to someone you trust who can help or connect you to others who can help you. Jordan Syatt [link to Matt’s video] recommends most people keep a list of what they eat as a way to be mindful of their consumption. Just a list, no numbers or calculations or meticulous rigidity.
- This article explores the data I gathered from my February 2020 Wellness Project. It doesn’t dig into how to use Microsoft Excel. You can learn about using Excel in the how-to video(s) that will be released soon. The video digs into such features as making tables, PivotTables, charts, PivotCharts, sparklines, and much more.
- My tracking was not perfect. I tried to make accurate estimates of portions when eating something with a nutrition label and I tried to find accurate estimates online when eating something without a nutrition label. I didn’t track zero-calories consumables, like water and herbal tea, or near-zero consumables, like most spices and some small peppers. Sometimes, I didn’t track the butter, olive oil, or soy sauce I used when cooking.
For the month of February, I tracked my consumption to create a snapshot of how many calories and grams of fat, carbohydrates, and protein I tend to eat in a month. My goal for February 2020 was to gather data to analyze in Excel and, then, to decide if I want to change anything about my consumption. Let’s dive into what I found.
Consumption Numbers
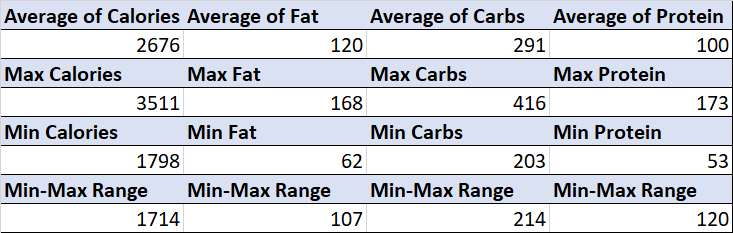
The maximum number of calories I ate in a day was 3511. The minimum was 1798. That’s a range of 1714 calories. My average number of calories per day was 2676.
First, for fat, my max was 168 g, my min was 62 g, that range is 106 g, and my average was 120 g. Then, for carbs, my max was 416 g, my min was 203 g, that range is 213 g, and my average was 291 g. Lastly, for protein, my max was 173 g, my min was 53 g, that range is 120 g, and my average was 100 g.
I summarized this data in a table and it is available in the sheet “Playing with Consumption Data” in the Excel workbook available at the beginning and end of this post.
Figure 1: Consumption Numbers Summary
It’s also helpful to visualize the data over time. I created a PivotChart that visualizes my daily calorie consumption as a bar chart and my fat, carbohydrate, and protein consumption as line charts. Relevant numbers for calorie consumption are on the left axis and relevant numbers for fat, carbohydrate, and protein consumption are on the right axis.
Figure 2: PivotChart for Daily Consumption
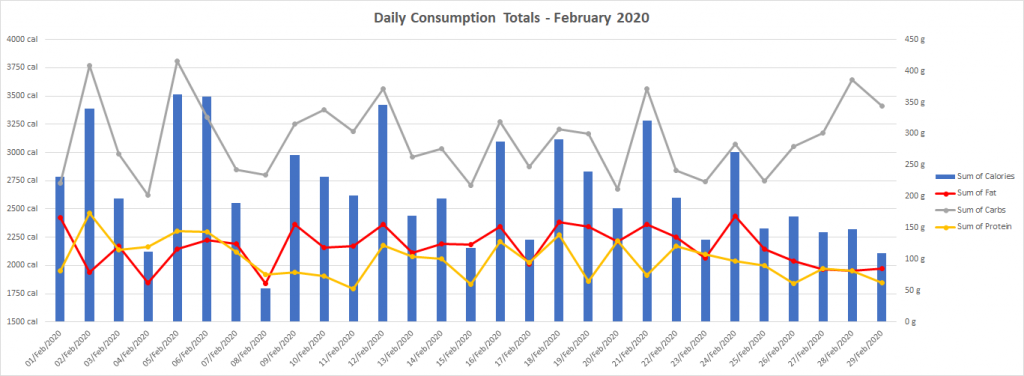
Note: Within this post, the distinction between a PivotChart and a chart is useless because there is none. But, if you open the attached workbook, you will see the importance of the distinction. A PivotChart changes as you filter the data in the associated table or PivotTable or change the source data, whereas a chart only changes as you change the source data.
Measurements
As mentioned in my launch post, roughly every week I measured my weight, waist, and hips. I entered the date and these three measurements into a table in Excel. This table is available in the sheet “Measurements” in the attached workbook.
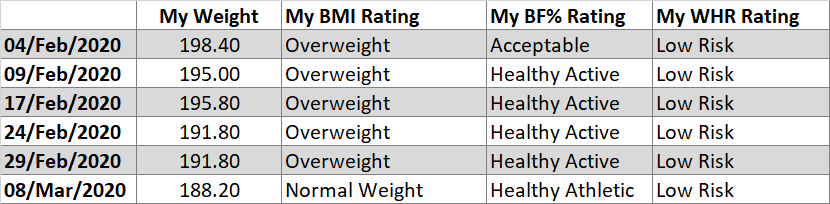
Using formulas available on bmi-calculator.net, I calculated my Body Mass Index (BMI), Body Fat Percentage (BF%), Waist/Hip Ratio (WHR), Basal Metabolic Rate (BMR), and Caloric Needs (to maintain current weight). Based on each calculation, I used nested If statements to list ratings for my Waist/Hip Ratio, BMI, and Body Fat Percentage. These ratings are also available online.
Below, you can see important data summarized in a PivotTable and the associated ratings summarized in another pivot table.
Figure 3: Measurement Numbers
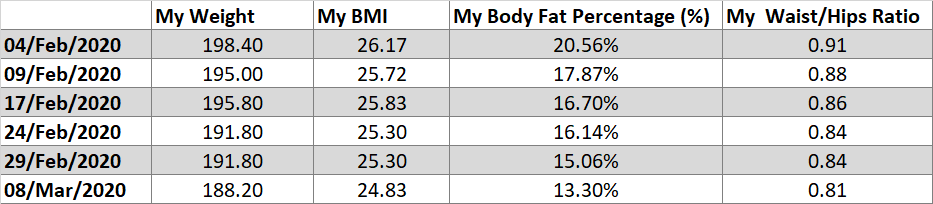
Figure 4: Measurement Ratings
Note: I stopped tracking consumption at the end of February, but I continue to measure myself weekly. Since I am posting this in March 2020, I am including my measurements up to the time of publication.
Results
My goal for February was to track my consumption and measurements, but I did not emphasize changing my behavior. As you look at Figures 3 and 4, you’ll notice that I lost over 10 pounds between 4 February 2020 and 8 March 2020, which seems to signify a change in behavior. This change may be in more areas of life than consumption, such as exercise or sleep behaviors.
I know that for me personally, tracking my behavior makes me change it, even if the change wasn’t the goal. I think my consumption changed too much day-to-day to notice a shift by looking at Figure 2, but by merely adding a trendline for my calorie consumption, you can see the general downward trend in my calorie consumption from approximately 3,000 calories to approximately 2500 calories.
Figure 5: Daily Consumption with Trendline

Note: I experimented with trendlines for my consumption of fat, carbs, and protein, but the change was minuscule and the extra lines cluttered the visualization. I decided to keep the trendline for calorie consumption because the difference was drastic and illustrative.
Going Forward
I have not been tracking my daily consumption during March 2020, though I remain mindful of my consumption.
I am unsatisfied with the current status of my nutrition and I want to change the following,
- Satiety. I don’t like eating and always feeling hungry immediately after my meal.
- Energy. I want to have more energy throughout the day.
- Body Fat Percentage. BMI and WHR are helpful, but BF% is the metric I find directly related to my perception of my health. It has decreased significantly since the beginning of February, but I’d like to slowly get it into the 10-11% range.
- Environmental Footprint. I want to reduce my footprint via my food choice, its source, and its packaging.
- Engagement with Food. I want to promote a positive relationship with food, including my buying, growing, preparing, and eating experiences.
I do not know how to approach changing each of these points. As long as I’m unsatisfied with my current nutrition, though, I think it’s prudent to continue experimenting. I’ll let you know of any experiments I begin.
Resources
Throughout this project, the following resources helped me in some way.
- I used formulas from a variety of calculators that are online. I took the formulas from bmi-calculator.net.
- WikiHow provided helpful articles for measuring waist and hips.
- Measure hips. https://www.wikihow.com/Measure-Hips
- Measure waist. https://www.wikihow.com/Measure-Your-Waist
- I frequently used MyFitnessPal.com from UnderArmour to estimate the nutritional value of foods without labels. Matt D’Avella talks about using the MyFitnessPal app in his video on counting calories.
- There’s an article on Healthline, medically reviewed by Daniel Bubnis, that discusses the relationship between body fat percentage and abdominal exposure. It helped me understand body fat percentage in general and the numbers differ slightly from those listed on bmi-calculator.net.
- It was difficult to make Figure 4 because you cannot normally have text fields appear as data in a PivotTable. However, I was able to find an article by Bill Jelen on Mr. Excel that helped me put text fields into the PivotTable.
- The Featured Image is a photo by Isaac Smith on Unsplash.
2 Replies to “Project Summary: Excel Project and Consumption Tracking”
Comments are closed.